AVAILABLE 24x7
888.662.2724
AVAILABLE 24x7
(888) 66CARAH
Fast & Accurate
Request A Quote

Quick Response
Chat With Us



Qlik Video
Demo Part 1: Bridging the Gap Between Numbers and Action
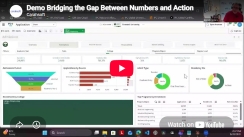
In this demo, Igor Alcantara, Director of Data Science at IPC Global, walks through the Qlik platform, demonstrating how to measure key metrics and build interactive dashboards. By organizing data into an accessible and easily navigable format, universities can gain a clearer view of their current financial position and better understand what lies ahead.
Key Takeaways
- Explore the Qlik platform and its data visualization capabilities.
- See how to measure key metrics and create dashboards.
- Learn how organized data can make financial information easier to navigate.
- Gain clearer insight into current fiscal-year performance.
- Explore how data can support visibility into future fiscal years.
Download the Resource