VividCharts ServiceNow App Self-Guided Tour  

VividCharts ServiceNow App Self-Guided Tour

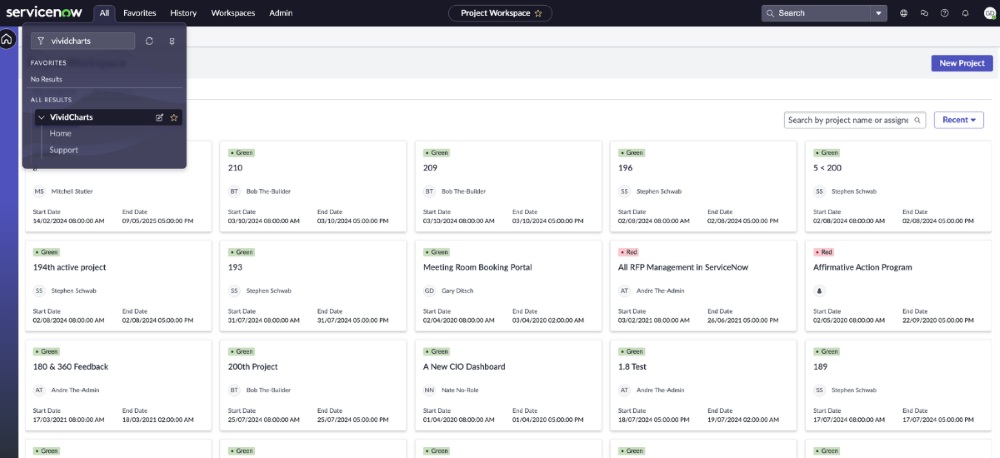
VividCharts is the reporting platform built natively for ServiceNow. It installs as a scoped app in your instance and reads your records in place, so there's no warehouse to fill, no connector to maintain, and no data leaving the platform. Teams build a report template once, then publish consistent dashboards, slide decks, and status reports that refresh with live data every cycle. Reviews start from the decision instead of a debate over whose numbers are right.
Step 1 of 5

Polished Viewer Experience

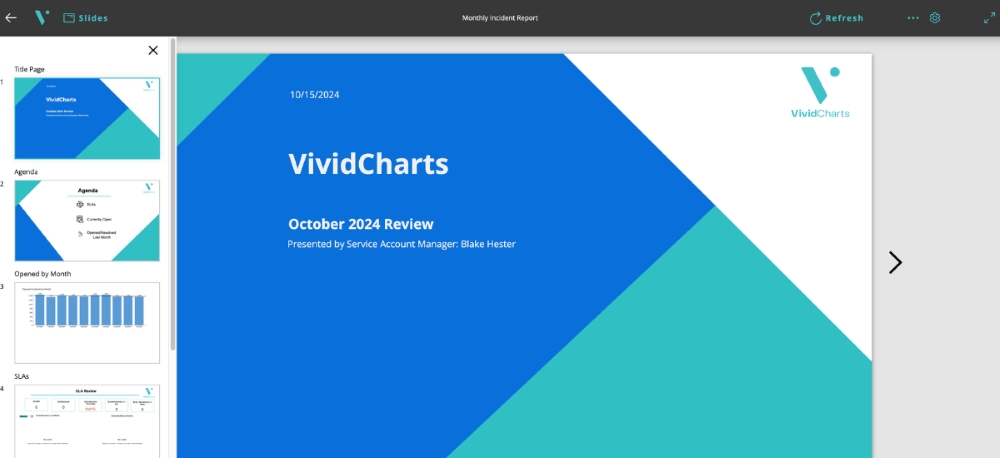
Allows you to present branded, high-quality dashboards and slide decks to your teammates and leadership directly in your ServiceNow instance. Our in-platform dashboards and slide decks can be exported to PowerPoint, PDF or PNG in a true-to-form format.

Polished Viewer Experience Polished Viewer Experience

Step 2 of 5

Freeform Editor

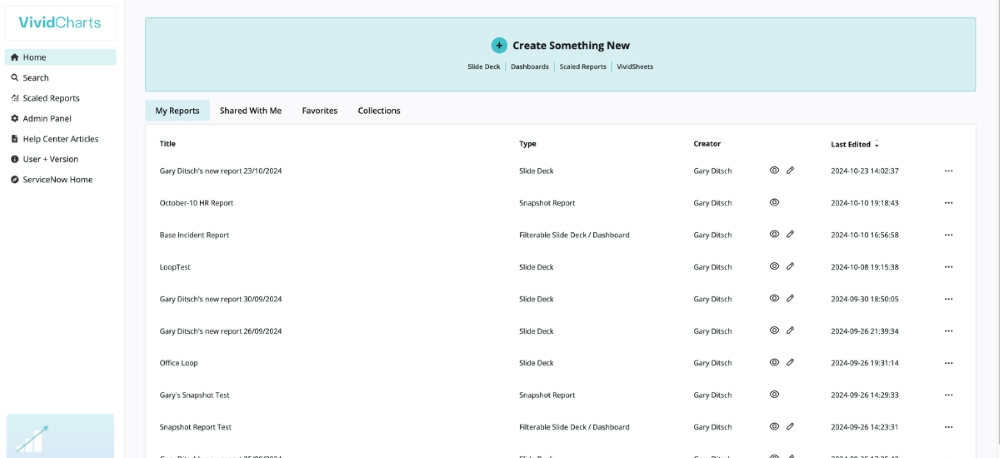
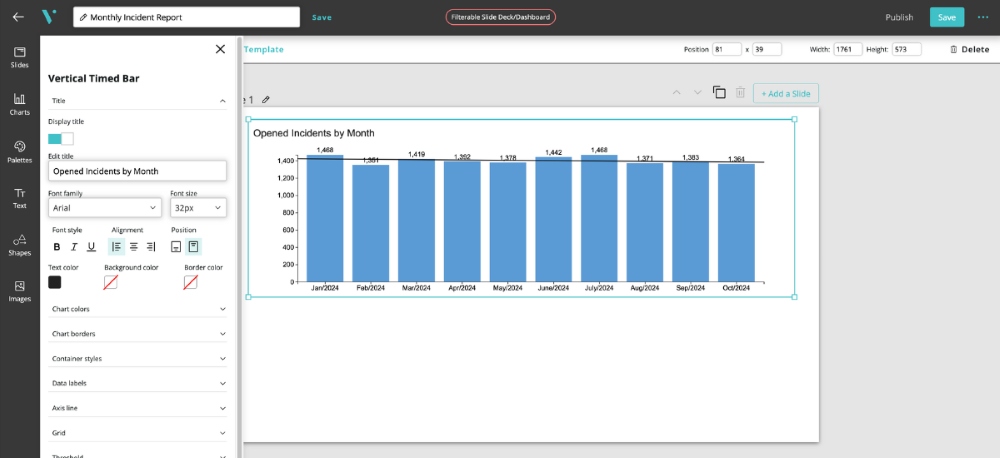
Gives you a new way to build reports in ServiceNow; the UI is a flexible, drag-and-drop, no-code or pro-code experience to create dashboards and slide decks in ServiceNow. We built our extensive chart library from the ground up to provide you with the most design control possible; this chart library gives ease of use to no-code builders, but also opens the door to pro-code reporters.

Freeform Editor Freeform Editor

Step 3 of 5

In-platform ServiceNow reporting tool

An in-platform ServiceNow reporting tool that supports your journey through the 3Ds of operational reporting. Data. Design. Delivery.

Data. Flexibility to manipulate your ServiceNow data without having to export to an external tool.

Design. Intuitive editing experiences, with a robust and flexible chart library, empowering you to build report templates on your own.

Delivery. Share reports to view within your instance via the VividCharts Viewer, or export them as high-fidelity files.

In-platform ServiceNow reporting tool In-platform ServiceNow reporting tool

Step 4 of 5

Key Features

> Scaled Reports Workflow - create report templates once and use them to generate consistent, accurate reports at scale.

> Automated Slide Deck Creation - Build custom slide templates that pull live ServiceNow data into polished presentations on-demand.

> Executive Dashboards - transform your ServiceNow data into stunning, presentation-ready dashboards tailored for executive stakeholders.

Key Features Key Features

Step 5 of 5

Ratings and Reviews

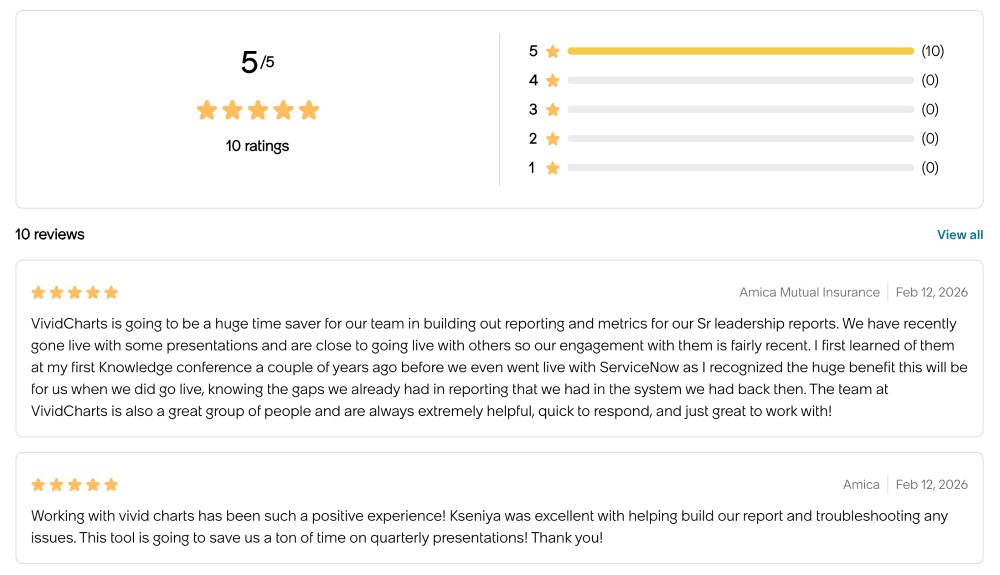
"VividCharts has been a huge time saver for our team. We've been using it for years. Their team is flexible and we have worked with them on some specific use cases that we couldn't solve with native reporting in ServiceNow. Slide deck creation is probably the biggest time-saver and it means we don’t have to spend hours pulling reports and formatting slides anymore—it’s all ready to go with the latest data. The executive dashboards give a clean, real-time view of key metrics without having to dig around or recreate each quarter."

Ratings and Reviews Ratings and Reviews