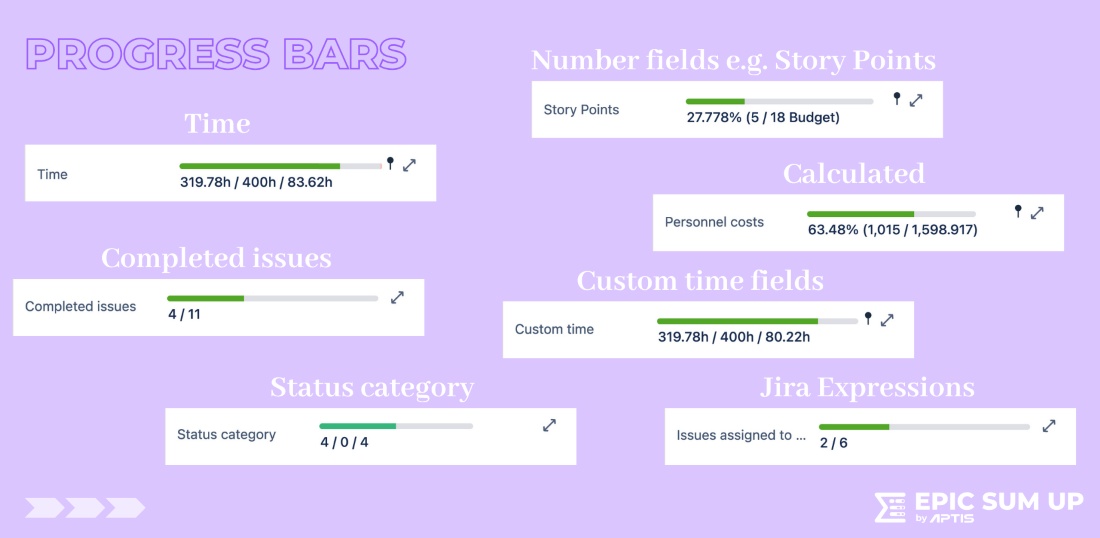
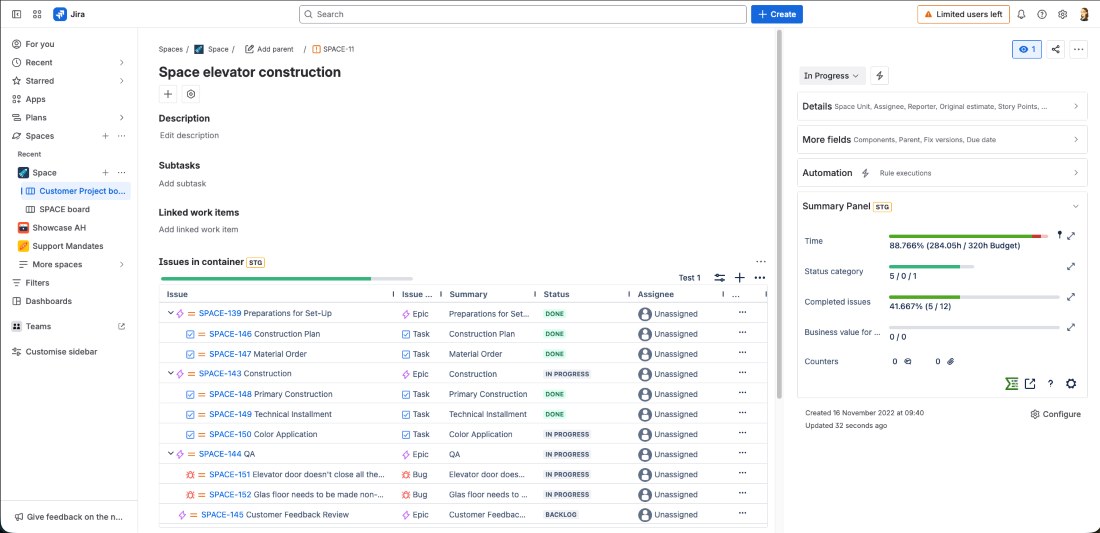
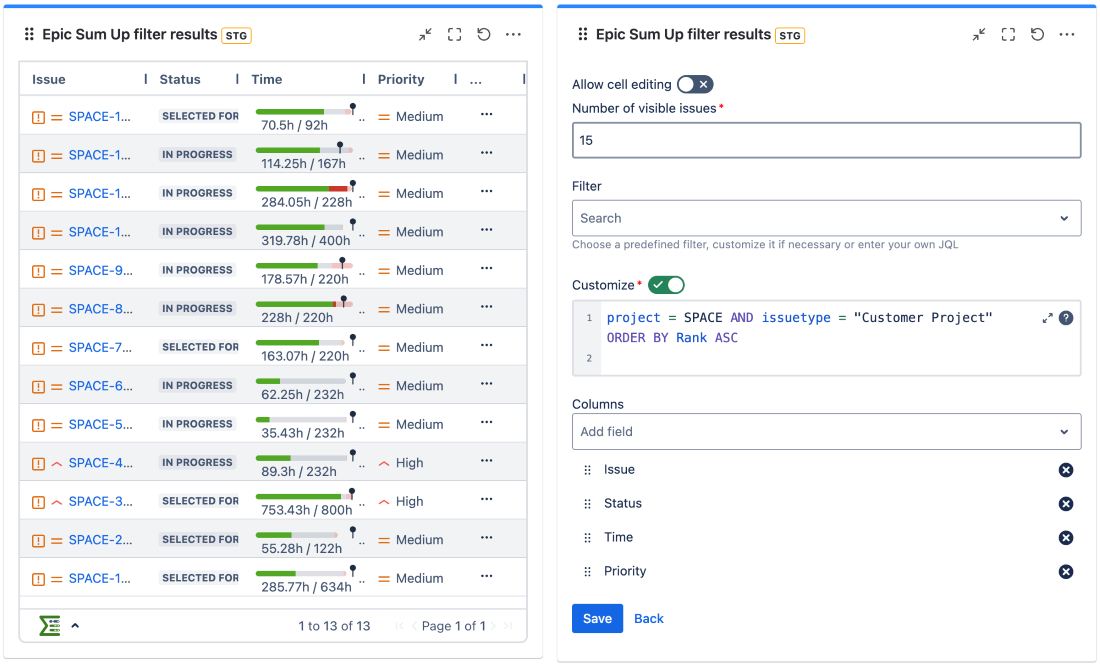
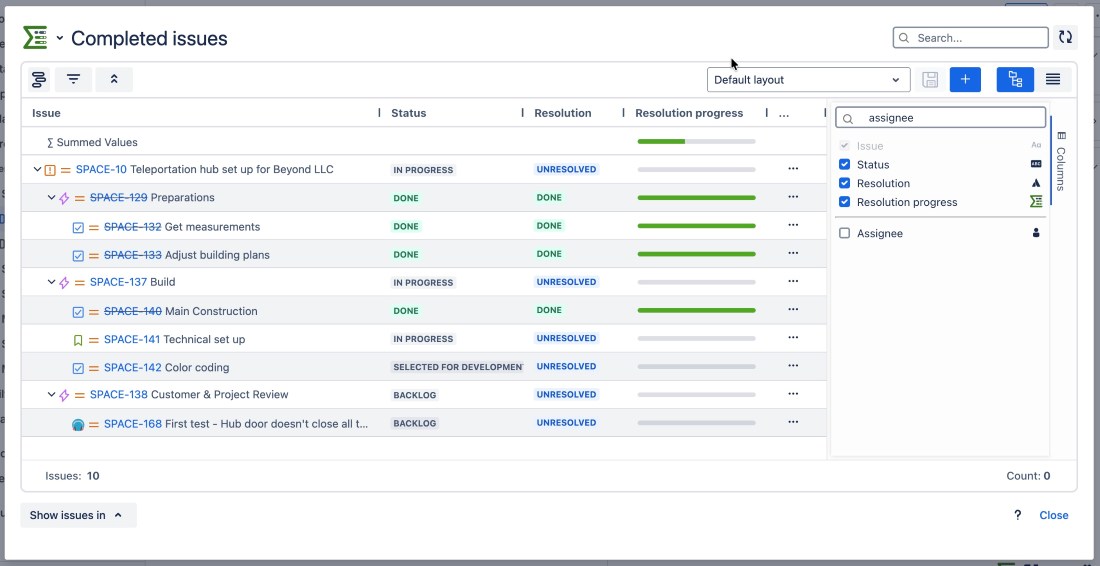
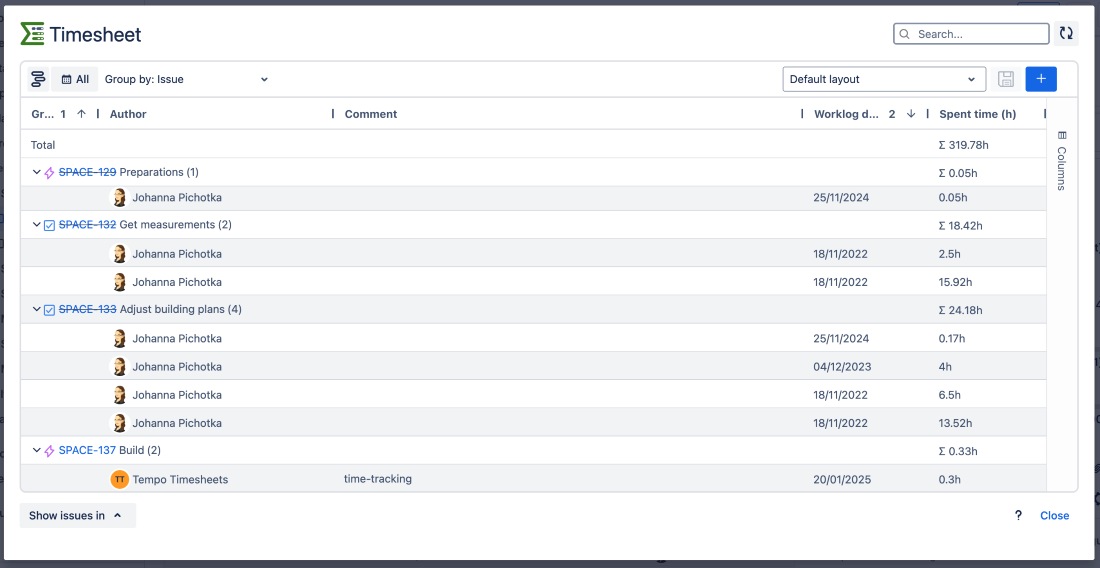
Gain instant visibility by adding progress bar visualizations that roll up live-calculated metrics, KPIs, and budget data from all child issues to their parent Epics as well as a fast, intuitive Excel-like bulk editor that allows project managers to manage and update thousands of Jira issues quickly.

Step 1 of 6

Progress Bars

The progress bars give you a clear visual overview of your work item's progress. You can choose different metrics: time, story points, business value or Jira number fields, Expressions, Calculations and display them as a progress bar. Budget markers can be added to enhance overall budget control. By clicking on a progress bar, the Detail View Editor opens up.

Progress Bars Progress Bars

  • Status overview
  • Budget control
  • Executive reporting
  • Visual summary
Step 2 of 6

Summary Panel

The Summary Panel is a customizable overview of key metrics important to your team. It consists of different progress bars and counters. You can find it on the right side of the work item view. Values are calculated live each time you open a work item. This ensures you always have up-to-date status information right where you need it.

Summary Panel Summary Panel

  • Project overview
  • Live reporting
  • Status update
  • Key metrics
Step 3 of 6

Dashboard Gadget

Your daily check-in place. Monitor different work items from different projects right on your dashboard, using progress bars and counters. This provides a consolidated view of all your most important work with key metrics in one place. All fields in the gadget can be edited, if editing is enabled.

Dashboard Gadget Dashboard Gadget

  • Easy monitoring of work items
  • Project management
  • Customizable view
  • Easy editing
Step 4 of 6

Detail View Editor

You can see your entire hierarchy from initiative to subtask. It offers simple Excel-like editing with shortcuts, copy & paste and inline editing. Powerful filtering options include default and column filters. You can save different column views, such as sprint planning, and export your data to Excel, CSV or print in 2 clicks.

Detail View Editor Detail View Editor

  • Problem identification
  • Simplified reporting
  • Fast bulk editing
  • Full hierarchy visibility
Step 5 of 6

Timesheet

It allows you to create detailed worklog reports. You can select specific time frames. Reports can be grouped by author, work item or date, filtered, and sorted according to your needs. All data can then be exported to Excel or CSV, or printed directly.

Timesheet Timesheet

  • Worklog reporting
  • Exporting to common file types
  • Time frame filtering
  • Easy worklog report creation

Comments & Attachments Overviews

Step 6 of 6

They let you view all comments and attachments across your hierarchy in one place. You can use text-based search to quickly find specific comments or files. Attachments can be browsed easily in the preview gallery. Overviews can be grouped by author, work item, or date.

Comment Overview thumbnail
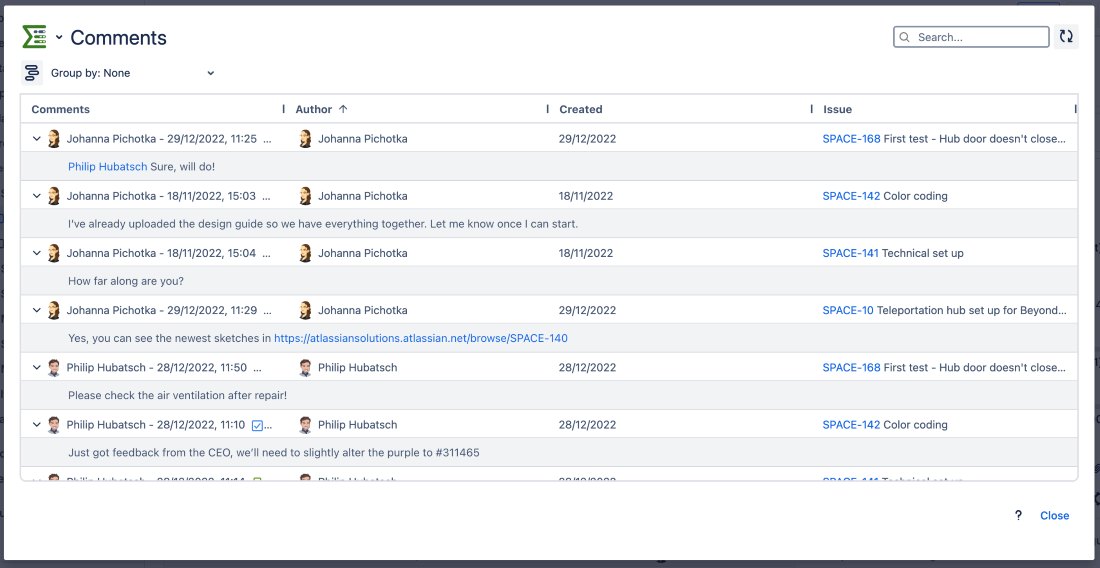
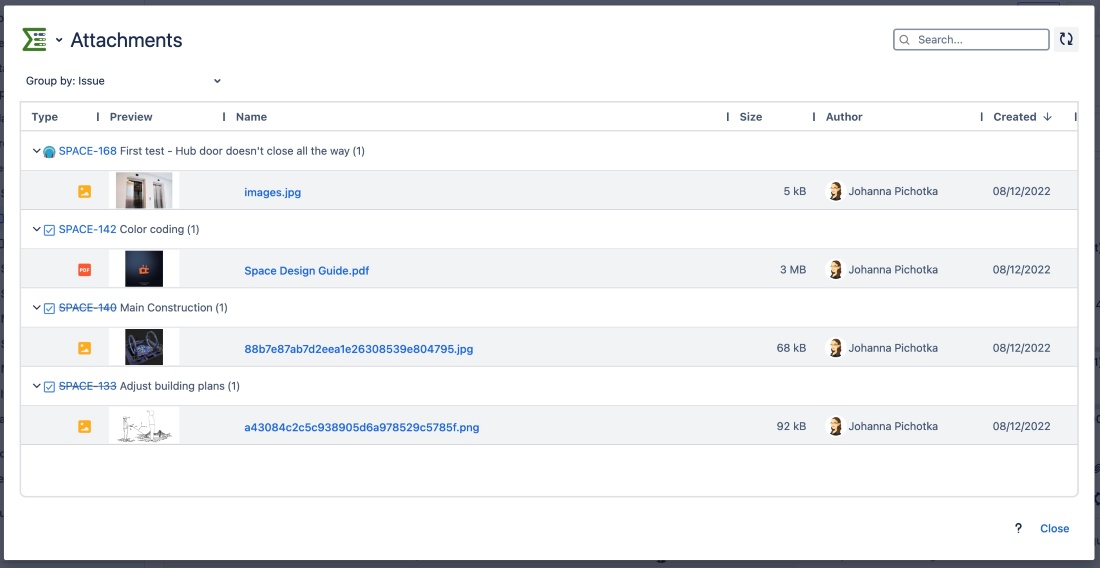
  • Quick & easy searching
  • Previewing files
  • Clustering
  • Find the right comment or attachment immediately
Attachment Overview thumbnail