SimiTech – Time in Status Reporter for Jira  

SimiTech – Time in Status Reporter for Jira

Measures exact time spent in each workflow status and assignee duration to help teams identify delays and optimize cycle times.
Step 1 of 5

Flexible Data Loading, Reporting, Calendars and Status Groups

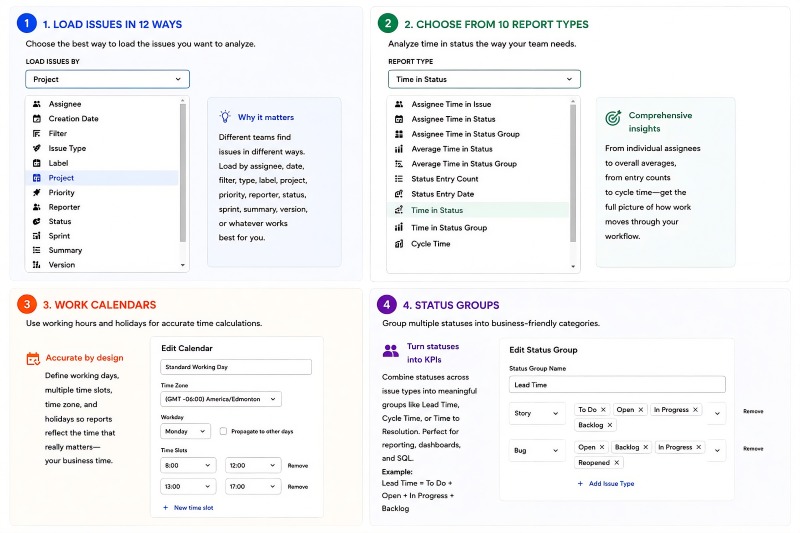
Time in Status Reporter for Jira gives teams broad control over both the data they analyze and the way time is calculated. Users can load Jira issues in 12 different ways and choose from 10 report types, ranging from assignee and status time to entry counts, averages, status groups and cycle-time reporting. Work calendars can model business hours, multiple time slots, time zones and holidays, while status groups turn workflow statuses into business metrics such as Lead Time, Cycle Time or Time to Resolution. Both global and user-level calendars and status groups let organizations standardize reporting where needed while still supporting team- or user-specific analysis.

Flexible Data Loading, Reporting, Calendars and Status Groups Flexible Data Loading, Reporting, Calendars and Status Groups

Benefits:

  • Load issues in 12 ways, including assignee, creation date, filter, issue type, label, project, priority, reporter, status, summary, version and JQL.
  • Choose from 10 report types for different operational and workflow questions.
  • Use global and user calendars so elapsed time can reflect real working schedules, holidays and time zones.
  • Use global and user status groups to combine workflow statuses into meaningful KPIs such as Lead Time and Cycle Time.
Step 2 of 5

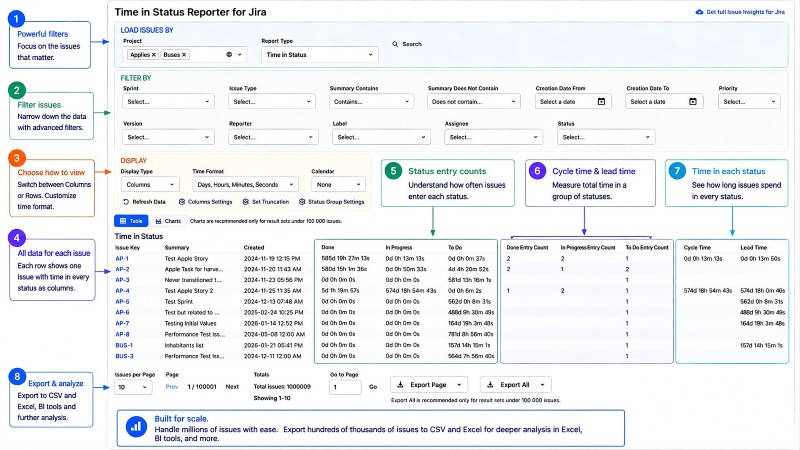
Pivot the Same Time-in-Status Data into Rows and Columns

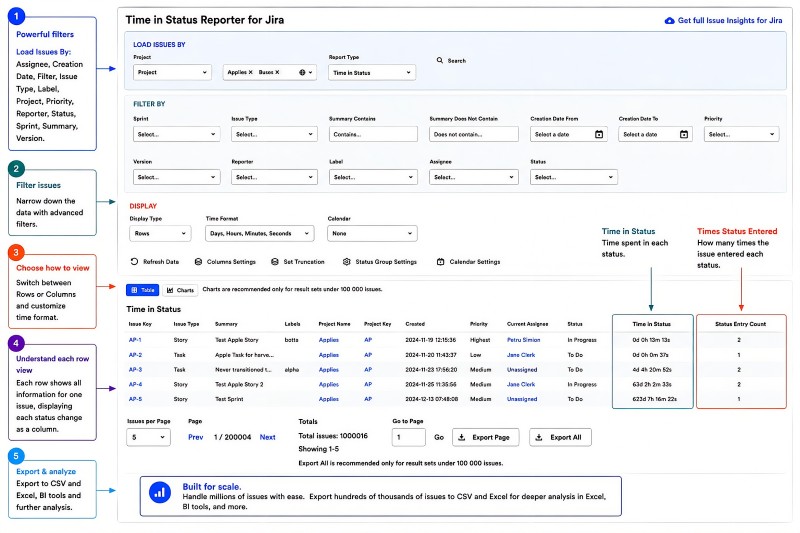
The Rows and Columns presentations let teams view the same time-in-status data from different perspectives. In the Columns presentation, each issue appears on one row and status metrics become columns, making it easy to compare how long an issue spent in individual statuses, how many times it entered each status, and how much time it accumulated across business-defined status groups such as Cycle Time or Lead Time. In the Rows presentation, these metrics are displayed as individual records, providing a detailed, structured view of the same underlying data. Teams can switch between the two presentations depending on their analysis needs, while both formats make large result sets easy to review and consume in spreadsheets, BI tools, and AI workflows. The app is built for scale, can work with more than one million issues, and can export hundreds of thousands of issues to CSV and Excel for deeper analysis.

Pivot the Same Time-in-Status Data into Rows and Columns Pivot the Same Time-in-Status Data into Rows and Columns

Benefits:

  • One issue per row with status time, status-entry counts and status-group metrics presented as columns.
  • Pivot-style Rows vs Columns presentation lets users choose the structure that best fits the analysis.
  • Built to handle more than one million issues and large Jira environments.
  • Export hundreds of thousands of issues to CSV and Excel for Excel, BI tools and AI-ready downstream analysis.
Step 3 of 5

Detailed Row-Based Time-in-Status Analysis

The Rows presentation provides a detailed event-style view of time in status, showing status information as individual rows rather than pivoted columns. Users can switch between Rows and Columns depending on whether they need detailed workflow history or a compact issue-level comparison. Powerful loading and filtering controls let teams focus on the exact Jira data they need before reviewing or exporting the results. The same large-scale dataset can be exported to CSV and Excel, making the information ready for Excel, BI platforms and AI-assisted analysis without locking users into a chart-only view.

Detailed Row-Based Time-in-Status Analysis Detailed Row-Based Time-in-Status Analysis

Benefits:

  • Switch between Rows and Columns without changing the underlying analysis goal.
  • Use detailed row-level results when users need to inspect status movement issue by issue.
  • Filter large loaded datasets to focus on the issues and workflow information that matter.
  • Export page or large result sets to CSV and Excel for further analysis in Excel, BI and AI tools.
Step 4 of 5

Average Time in Status and Bottleneck Analysis

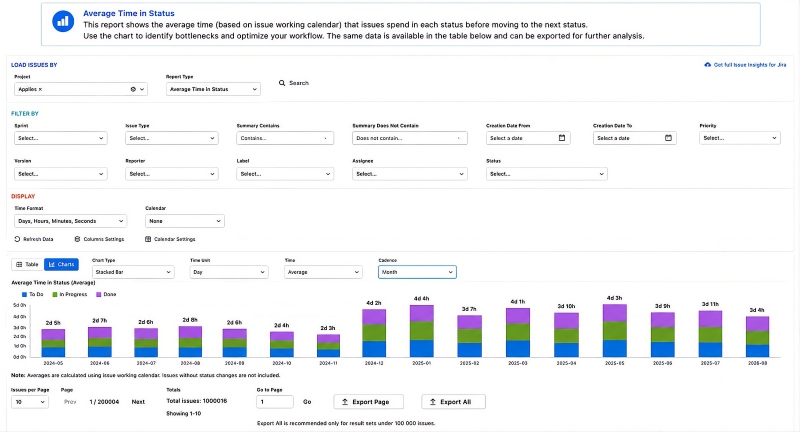
Average Time in Status turns Jira workflow history into an immediate view of where work is spending time. The report calculates average time using the selected issue working calendar and can visualize status time over a chosen cadence, helping teams identify bottlenecks and changing workflow patterns. Users can move between chart and table views and retain access to the underlying data rather than being limited to the visualization. Results can also be exported to CSV and Excel for deeper analysis, combining fast human-readable insight with reusable data for Excel, BI and AI workflows.

Average Time in Status and Bottleneck Analysis Average Time in Status and Bottleneck Analysis

Benefits:

  • Identify bottlenecks by comparing average time spent in workflow statuses.
  • Apply working calendars so averages reflect business time rather than only wall-clock time.
  • Switch between chart and table views depending on the audience and analysis.
  • Export the underlying data so visual insights remain reusable outside Jira.
Step 5 of 5

Forge Architecture, Data Control and Enterprise Trust

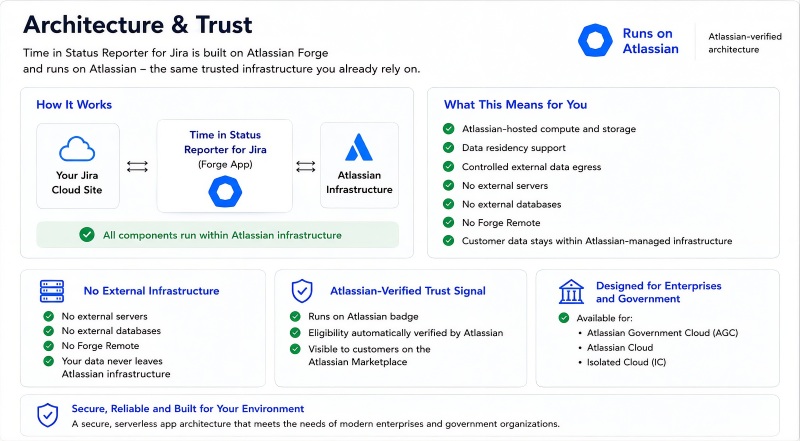
Time in Status Reporter for Jira is built on Atlassian Forge and runs on Atlassian-managed infrastructure. The architecture uses no external servers, no external databases and no Forge Remote, so customer data stays within Atlassian-managed infrastructure rather than being sent to vendor-hosted systems. This reduces external infrastructure dependencies while supporting the security and deployment expectations of enterprise and government customers. The app is designed for Atlassian Cloud, Atlassian Government Cloud (AGC) and Isolated Cloud (IC), giving Carahsoft sales teams a strong architecture and trust story alongside the product's large-scale reporting capabilities.

Forge Architecture, Data Control and Enterprise Trust Forge Architecture, Data Control and Enterprise Trust

Benefits:

  • Built on Atlassian Forge and Runs on Atlassian.
  • No external servers, no external databases and no Forge Remote.
  • No customer-data egress to vendor-hosted infrastructure; customer data stays within Atlassian-managed infrastructure.
  • Designed for enterprise and government deployment, including Atlassian Cloud, AGC and IC.