SimiTech - Assets History & Snapshots Reporter for Jira
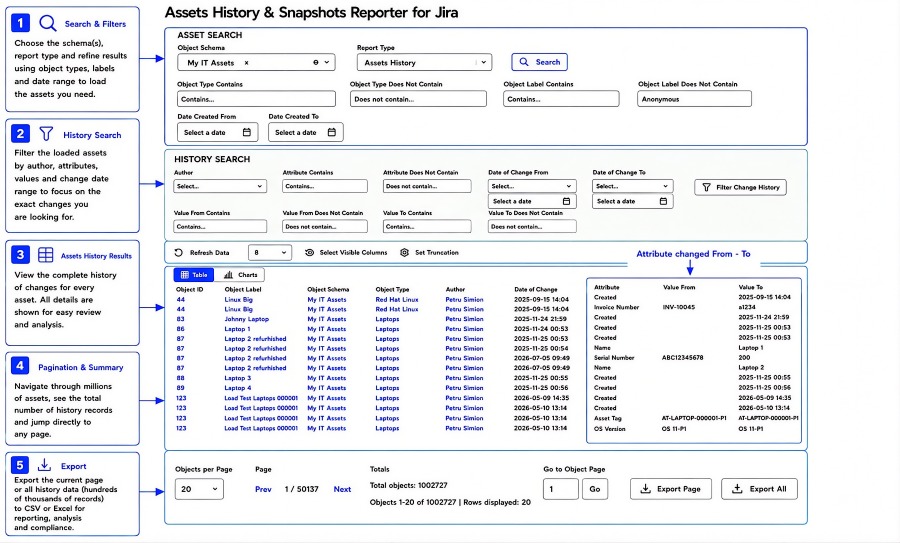
Tracks complete object history and point-in-time configuration snapshots across JSM Assets to identify drift and support compliance.
Point-in-Time Asset Snapshot - Rows
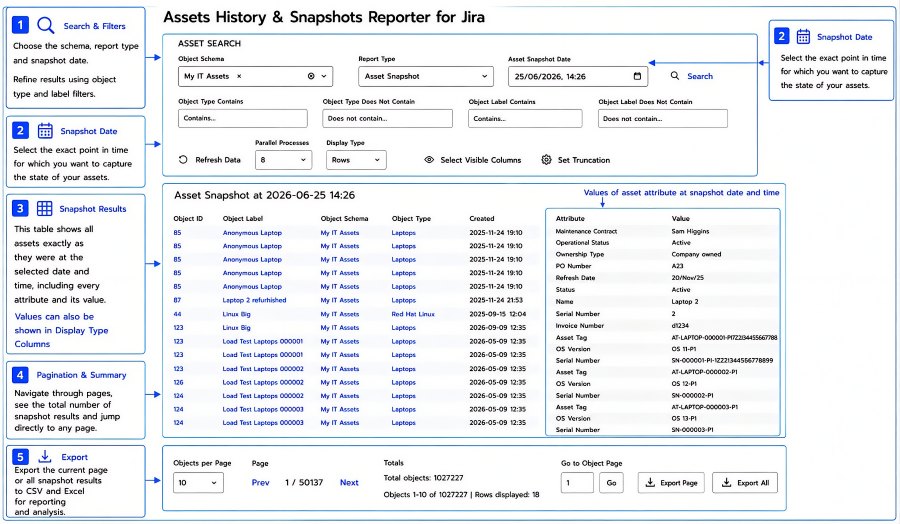
View the same point-in-time asset snapshot in a row-oriented format when attribute-by-attribute analysis is preferred. Each row identifies the asset together with an individual attribute and the value that attribute had at the selected snapshot date and time. Asset identity, schema, type, and creation information remain visible beside the attribute and value, preserving the context of every record. Users can switch between Rows and Columns display types depending on how they want to review or export the historical snapshot data.
Benefits:
- Inspect each historical asset attribute and its value as an individual row.
- Keep asset identity and context visible beside every attribute/value pair.
- Switch between Rows and Columns display types.
- Export snapshot results to CSV and Excel for reporting and analysis.
Point-in-Time Asset Snapshot - Columns
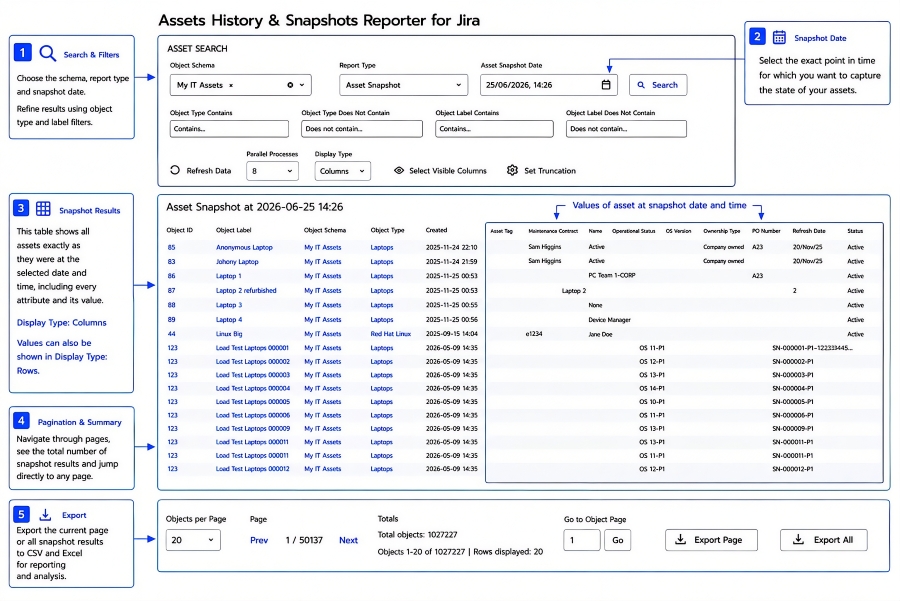
Reconstruct the state of assets at an exact historical date and time. Select an object schema, choose Asset Snapshot, specify the snapshot date and time, and refine the results using object type and label filters. In Display Type Columns, each asset appears as a row while its attributes and historical values are displayed across columns, allowing many assets to be reviewed simultaneously. Large snapshot result sets can be navigated with pagination and direct page access and exported to CSV and Excel for reporting, analysis, audits, and downstream processing.
Benefits:
- See exactly what assets looked like at a selected point in time.
- Review each asset and its historical attribute values in a columns-based layout.
- Navigate very large snapshot result sets with pagination and direct page access.
- Export the current page or all snapshot results to CSV and Excel.
Point-in-Time Asset Snapshot - Rows
View the same point-in-time asset snapshot in a row-oriented format when attribute-by-attribute analysis is preferred. Each row identifies the asset together with an individual attribute and the value that attribute had at the selected snapshot date and time. Asset identity, schema, type, and creation information remain visible beside the attribute and value, preserving the context of every record. Users can switch between Rows and Columns display types depending on how they want to review or export the historical snapshot data.
Benefits:
- Inspect each historical asset attribute and its value as an individual row.
- Keep asset identity and context visible beside every attribute/value pair.
- Switch between Rows and Columns display types.
- Export snapshot results to CSV and Excel for reporting and analysis.
Asset Snapshot Comparison
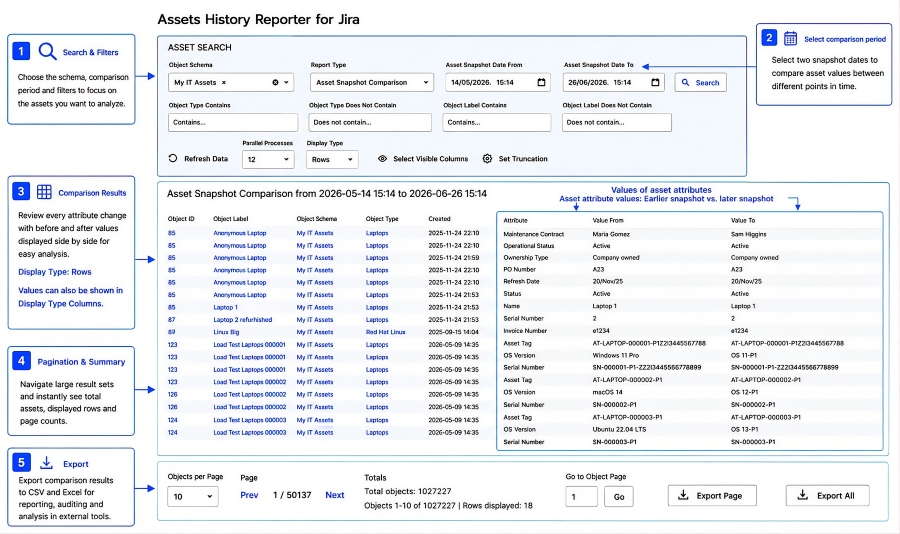
Compare asset values between two historical points in time to identify exactly what changed. Select an earlier and a later snapshot date and review each asset attribute with its earlier and later values displayed side by side. This removes the need to manually reconstruct two historical states and compare individual objects one at a time. Large comparison result sets can be paged, reviewed, and exported to CSV and Excel for auditing, investigations, reporting, compliance, and external analysis.
Benefits:
- Compare asset state between two historical dates.
- See earlier and later values side by side for each asset attribute.
- Identify changes across many assets in a single comparison report.
- Export comparison results to CSV and Excel for auditing and external analysis.
Asset Snapshot Comparison
Compare asset values between two points in time to see exactly what changed across your Assets data. Select the object schema, comparison dates and filters, then review earlier and later attribute values side by side in Rows or Columns. Export comparison results to CSV and Excel for reporting, auditing and further analysis.
Benefits:
- Select two snapshot dates and quickly identify how asset data changed between them.
- Review attribute values from the earlier and later snapshots side by side for clear, detailed comparison.
- Filter, paginate and navigate large comparison result sets while viewing results in Rows or Columns.
- Export the current page or complete comparison results to CSV and Excel for audits, reporting, compliance and deeper analysis.
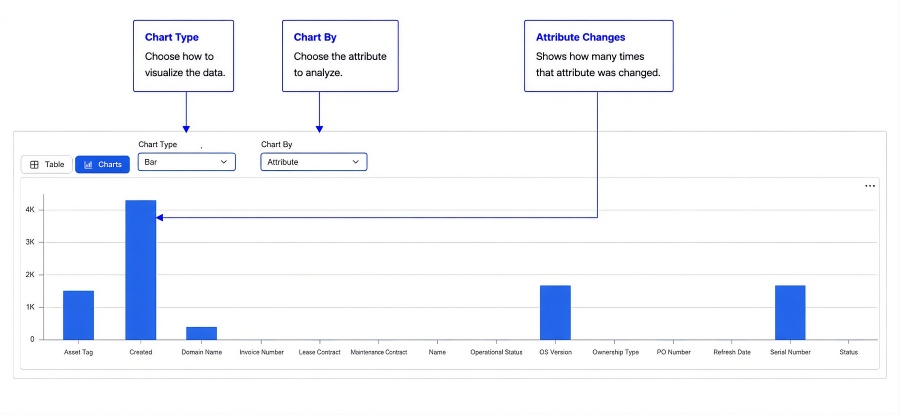
Visualize the loaded Assets history directly from the report. Choose the chart type and select what the history should be charted by, such as Attribute, to turn large volumes of change records into an immediate visual summary. When Chart By is set to Attribute, each bar shows how many times that asset attribute was changed in the loaded history. The chart view complements the detailed history table by making high-activity attributes and broader change patterns easier to identify.
Benefits:
- Visualize loaded asset history without leaving the report.
- Choose the chart type and the dimension used for analysis.
- See how many times each asset attribute was changed.
- Switch between detailed table data and chart-based visualization.