SaaSJet - Time in Status
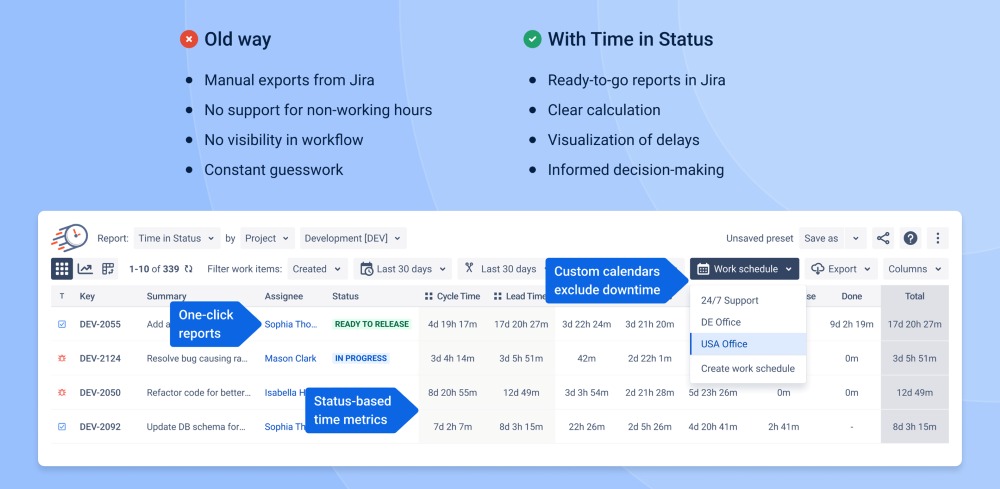
Automatically calculates how long issues spend in each status, assignee, or team. This tool generates data-driven reports to help project managers identify bottlenecks and optimize workflow velocity.
Work Schedule-Based Status Time Reports
Time in Status reporting helps teams understand where work slows down by showing how long issues remain in each workflow step and how often they move through statuses. Instead of relying on gut feel, teams can measure cycle-time contributors, identify recurring queues (e.g., “Waiting for Review,” “Blocked,” “QA”), and pinpoint the exact stage causing delays. Reports can be scoped to the right slice of work (project, sprint, assignee, JQL, saved filters, etc.) and to the right time window, so the analysis matches the question (e.g., “resolved last week” vs. “time spent last week”). This turns Jira workflow history into actionable operational insights, enabling faster process improvements, better forecasting, and more reliable delivery commitments.
Benefits:
- Expose bottlenecks and hidden queues: Quickly see which statuses consistently accumulate time so you can fix process blockers and reduce end-to-end cycle time.
- Improve predictability and delivery confidence: Use consistent, time-bounded reporting to track throughput/cycle-time trends and make forecasts and commitments based on evidence.
- Increase accountability and team performance visibility: Understand how work flows across assignees and stages to balance workload, improve handoffs, and coach process improvements.
- Make SLA and operational reporting easier: Separate business hours vs. off-hours (where relevant) to measure responsiveness and compliance more accurately.
Sprint Performance Report (Velocity, Workload, Carryover & Active Sprint Burndown)
The Sprint Performance Report gives Scrum teams a single, reliable view of sprint health so they can course-correct early and improve outcomes sprint over sprint. It converts sprint data into decision-ready insights—showing whether the team is on track, how much scope changed after the sprint started, and where delivery risk is building. For active sprints, the report updates in real time with a burndown view so teams can detect stalled progress or sudden scope growth before it’s too late. Because the report is based on the board’s JQL filter and your board’s estimation method (Story Points, issue count, or original time), it stays consistent with how the team actually plans and measures work.
Benefits:
- Keep the sprint on track in real time: Active sprint burndown highlights when progress stalls, when scope expands, and whether the team can still hit the sprint goal—so action happens before the sprint ends.
- Reduce scope creep and improve planning discipline: Clear added/removed scope metrics make mid-sprint changes visible, helping teams protect focus and negotiate trade-offs with stakeholders.
- Strengthen predictability over time: Velocity and completion trends across recent sprints help teams calibrate commitments, set realistic sprint goals, and forecast delivery with more confidence.
- Drive better retrospectives with evidence: Carryover, completion rate, flagged items, and status-time signals make it easier to identify root causes and prioritize improvements.
Dashboard Gadgets for Time-in-Status & Workflow Burndown Tracking
Dashboard Gadgets bring time-in-status and workflow flow analytics directly into Jira dashboards so teams can monitor delivery health without running ad-hoc reports. This turns historical status data into always-on visual signals—helping teams spot slowdowns, rising queues, and shifting trends early. Teams can tailor gadgets to match their real workflow by choosing the exact report type, filters (project/sprint/assignee/JQL, etc.), date ranges, and working calendar—so the dashboard reflects what matters most. For deeper flow control, the Burndown Status Tracker gadget shows how work moves through statuses and highlights where it gets stuck, enabling faster intervention and smoother throughput.
Benefits:
- Real-time visibility into delivery risk: See trends and status-time signals on the dashboard to catch bottlenecks and stalled work before they impact sprint/release outcomes.
- Faster decision-making for leaders and teams: Key metrics are always available in a shared dashboard view, reducing time spent building reports and aligning stakeholders on the same facts.
- Consistent reporting across the org: Shared gadget configurations ensure everyone tracks the same KPIs (with the same filters, timeframes, and calendars), improving comparability across teams.
- More actionable drill-downs: Visual charts connect back to the underlying issue lists, making it easy to move from “something’s off” to “here are the exact tickets causing it.”
Custom Time-in-Status Fields for Board-Level Productivity Metrics
Custom Time-in-Status fields make workflow time visible directly on Jira issues and board cards, so teams can spot aging work and take action before delivery slips. By turning status history into live, schedule-aware values (business hours vs. 24/7), teams measure what actually matters—working time—not nights and weekends. Teams can also combine multiple statuses into one field to create practical delivery KPIs like Lead Time, Cycle Time, Active Time, or Time to Resolution, making bottlenecks and waiting states measurable at the issue level. Because these fields can be used in JQL (including duration comparisons), teams can proactively find and manage at-risk items (e.g., “Review time > 2h”) and keep flow healthy.
Benefits:
- Stop “stuck work” before it becomes late work: Surface issue aging on cards and in issue views so blockers and long waits are obvious and addressed earlier.
- Measure delivery time the way the business experiences it: Schedule-aware calculations separate working hours from off-hours, improving planning accuracy and SLA reporting.
- Create actionable flow KPIs without manual tracking: Group statuses into metrics like cycle time or time to resolution, making process performance measurable per issue and per workflow step.
- Enable proactive management with JQL-based targeting: Query duration thresholds to automatically identify risk (e.g., overlong review/testing) and prioritize intervention.